A Game of Margins: How Efficiency Outplayed Control at Rogers Centre
There are baseball games where the scoreboard tells the story—and then there are games where it hides it.
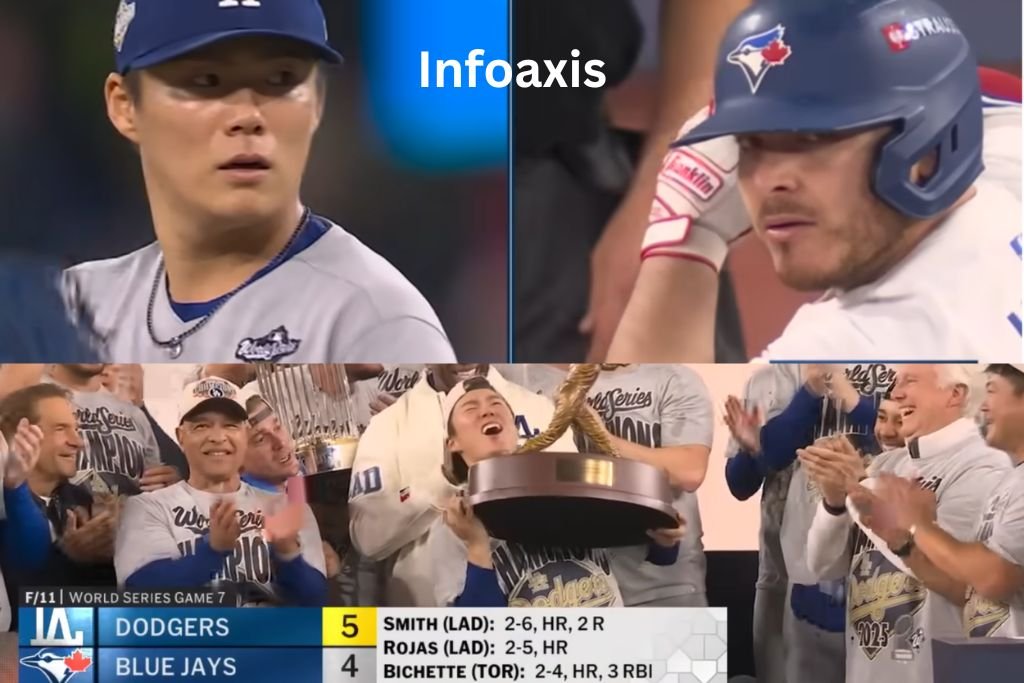
The Toronto Blue Jays’ 14 hits suggested control, rhythm, and offensive command. The Los Angeles Dodgers’ 11 hits suggested something quieter. Yet when the dust settled, the Dodgers walked away with a 5–4 extra-inning victory, exposing a truth that modern baseball keeps reinforcing:
Dominance is not measured in volume—it is measured in conversion.
At Rogers Centre, this was not just a contest of talent. It was a study in execution, decision-making, and situational awareness under pressure.
Game Context and Structural Overview
| Element | Detail |
|---|---|
| Competition | MLB Regular Season 2026 |
| Location | Rogers Centre, Toronto |
| Final Outcome | Dodgers 5 – Blue Jays 4 (Extra Innings) |
| Game Type | Low-margin, high-leverage contest |
| Strategic Theme | Efficiency vs Sustained Pressure |
From the opening innings, both teams established contrasting identities. Toronto leaned into sustained offensive construction. Los Angeles relied on selective aggression and high-value contact.
That contrast did not just shape the game—it decided it.
The Statistical Illusion: When More Doesn’t Mean Better
| Core Metric | Blue Jays | Dodgers |
|---|---|---|
| Hits | 14 | 11 |
| Runs | 4 | 5 |
| Batting Average | .311 | .262 |
| Slugging % | .467 | .541 |
| Home Runs | 1 | 3 |
| Left on Base | 14 | 8 |
At surface level, Toronto appears superior. More hits. Higher average. Greater offensive continuity.
But baseball is not linear.
The Dodgers produced:
- Higher slugging output
- Greater run efficiency
- More decisive scoring events
The gap between activity and impact is where this game was decided.
Efficiency Metrics: The Real Engine of Victory
| Advanced Indicator | Blue Jays | Dodgers |
|---|---|---|
| OPS | .839 | .889 |
| Runs per Hit | 0.29 | 0.45 |
| HR per Hit | 7.1% | 27.3% |
| RISP | .176 (3/17) | .286 (4/14) |
| Hard Contact % | 41% | 48% |
| Barrel Rate | 6.8% | 12.4% |
These numbers strip away narrative and expose structure.
Toronto:
- Created traffic
- Extended innings
- Controlled tempo
Los Angeles:
- Created damage
- Maximized opportunity
- Compressed scoring into fewer moments
The Dodgers’ barrel rate nearly doubled Toronto’s, indicating consistently superior contact quality—balls struck with optimal trajectory and exit velocity.
Toronto’s Offensive Model: Structure Without Resolution
Toronto’s offensive framework was built on reliability.
- Frequent base runners
- Controlled swing decisions
- Strong top-order production
Vladimir Guerrero Jr. and Bo Bichette anchored this system effectively, maintaining pressure throughout multiple innings.
But pressure requires payoff.
Critical Breakdown:
- 14 runners left on base
- 3-for-17 with runners in scoring position
- Zero runs in late innings
This is not just inefficiency—it is systemic failure in high-leverage execution.
Toronto did not lose because they were outplayed.
They lost because they were out-finished.
Dodgers’ Offensive Identity: Impact Over Accumulation
The Dodgers approached the game with a fundamentally different offensive philosophy.
They did not attempt to build innings.
They waited to break them open.
- 3 home runs
- Highest slugging percentage in the game
- Superior conversion rate per opportunity
Players like Max Muncy and Will Smith delivered high-leverage outcomes, where a single swing replaced multiple at-bats worth of effort.
This is the modern offensive model: fewer swings, greater consequence.
Power Differential: The Decisive Variable
The most defining statistical gap in the game:
- Dodgers HR rate: 27.3% of hits
- Blue Jays HR rate: 7.1% of hits
This is not a small difference—it is structural.
Home runs:
- Eliminate sequencing risk
- Remove defensive variables
- Instantly convert base states into runs
Toronto required multiple events to score.
Los Angeles required one.
That difference is everything.
Pitching Dynamics: Control vs Closure
Blue Jays Pitching
Toronto’s starter delivered a high-quality performance:
- Low ERA output
- Controlled early innings
- Limited damage against top hitters
For much of the game, Toronto dictated pace.
But control is only valuable if it extends to the end.
Dodgers Pitching
Los Angeles relied on layered pitching strategy:
- Stable starting phase
- Elite bullpen transition
With a bullpen ERA of 2.45, the Dodgers:
- Neutralized late-game threats
- Maintained strike-zone discipline
- Avoided high-risk pitch sequences
The difference was not in starting pitching—it was in late-inning authority.
Extra Innings: Where Execution Becomes Identity
Extra innings remove noise. What remains is clarity.
Toronto entered with opportunity—but not structure.
Los Angeles entered with intent.
- Dodgers extra-inning efficiency: 100%
- Blue Jays extra-inning efficiency: 0%
The outcome was immediate.
One decisive swing ended the game—not because of luck, but because of preparation meeting pressure.
Defensive Discipline: The Invisible Separator
| Defensive Element | Blue Jays | Dodgers |
|---|---|---|
| Errors | 1 | 0 |
| Defensive Stability | Inconsistent | Controlled |
Toronto’s single error may seem minor—but in high-leverage baseball, errors do not exist in isolation.
They:
- Extend innings
- Increase pitch counts
- Shift momentum
The Dodgers avoided all of that.
Player Impact: Timing Over Talent
Toronto
- Guerrero Jr.: High-contact production, limited situational impact
- Bichette: Consistent presence, low conversion in key moments
- Springer: Pressure creator, not a finisher
Dodgers
- Muncy: Power-driven scoring
- Will Smith: High-leverage execution
- Supporting lineup: Disciplined and efficient
Talent was not the difference.
Timing was.
Strategic Insight: What This Game Teaches
This game is a case study in modern baseball efficiency.
It reinforces four critical principles:
- Volume without conversion is neutralized
- Power compresses scoring into fewer opportunities
- Bullpen depth determines late-game outcomes
- Clutch execution defines elite teams
Toronto excelled in process.
Los Angeles excelled in outcome.
Why This Match Matters in a Broader Context
This was not just a regular-season game—it was a reflection of how baseball is evolving.
Teams that prioritize:
- Exit velocity
- Barrel efficiency
- Situational discipline
…are outperforming teams built on traditional contact-heavy models.
The Dodgers represent that evolution.
The Blue Jays, in this game, exposed its consequences.
Frequently Asked Questions
1. What was the final result?
Dodgers won 5–4 in extra innings.
2. Why did Toronto lose despite more hits?
Poor RISP performance and low power efficiency limited scoring.
3. What was the biggest statistical difference?
Home run rate and runs per hit.
4. How important was bullpen performance?
Critical—Dodgers bullpen controlled the game late.
5. What does this game indicate about modern MLB?
Efficiency, power, and execution outweigh raw offensive volume.
Conclusion: The Difference Between Control and Victory
For much of the game, Toronto controlled the field.
They dictated tempo.
They generated opportunities.
They applied pressure.
But control is not victory.
The Dodgers demonstrated something more valuable:
- Precision
- Composure
- And the ability to deliver when it mattered most
In the end, the scoreboard did not reward the team that did more.
It rewarded the team that did enough, at exactly the right moments.
For deeper, structured breakdowns like this—where data meets tactical understanding—platforms like Infoaxis continue to push beyond surface-level analysis and into the true mechanics of the game.
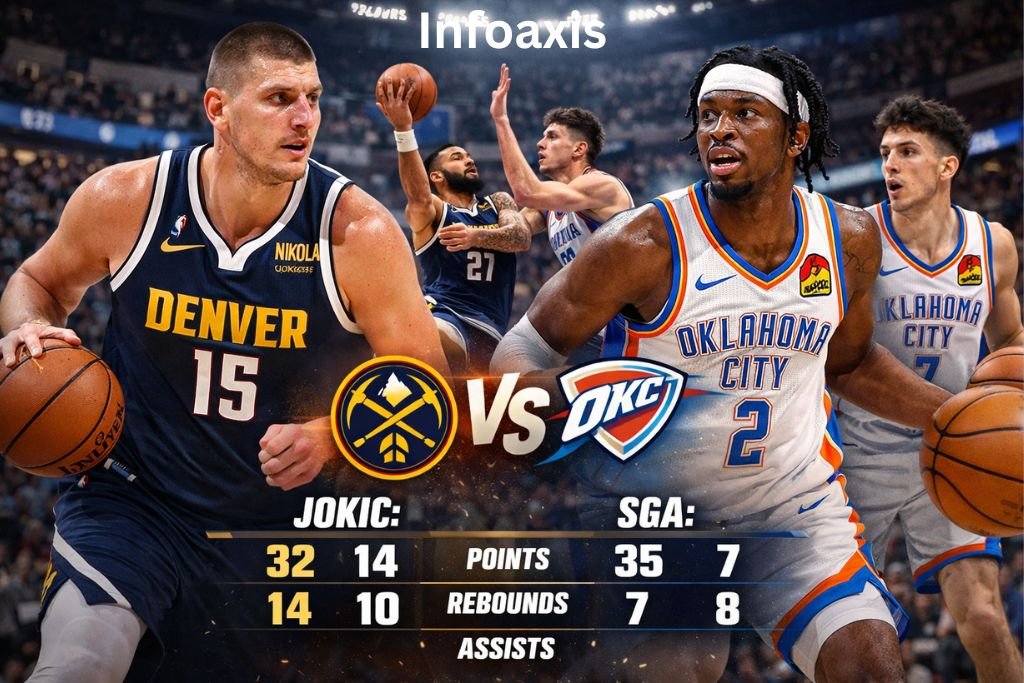
Read More : Denver Nuggets vs Oklahoma City Thunder Match Player Stats
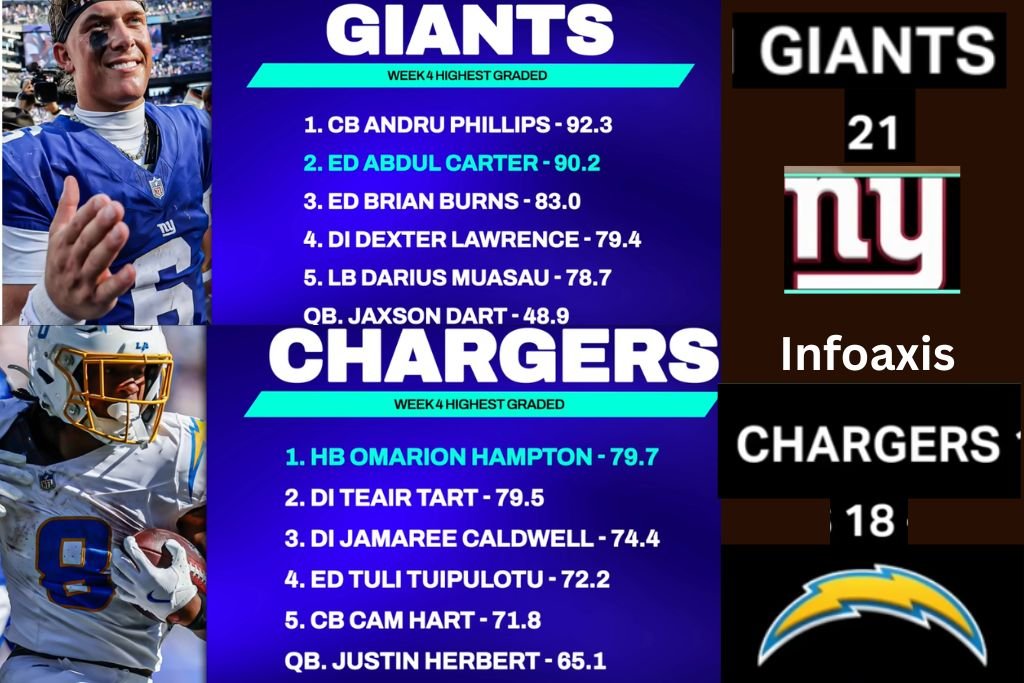
Read More : Los Angeles Chargers vs New York Giants Match Player Stats


Leave a Reply